The state of Minnesota’s workforce in five charts
Despite the many changes that Minnesota’s economy experienced over the past two years, its labor market has remained remarkably stable. Minnesota ended December 2023 with a seasonally adjusted unemployment rate of 2.9%. The December before that in 2022, the state’s unemployment rate was also 2.9%. And the December before that in 2021, it was nearly identical at 3.0%. At the core of this stable job market lies two factors: one positive and one negative.
On the upside, Minnesota’s persistently low unemployment numbers point to steady demand from employers to fill jobs and meet demand. Businesses continue to recover and grow in the wake of the pandemic-recession and need more workers to operate at full capacity.
The downside is that Minnesota’s supply of available workers has not recovered from the exodus experienced in 2020 and early 2021 when more than 97,000 Minnesotans left the labor force. As of December 2023, Minnesota still had 31,449 fewer people working or actively seeking work than it did in January of 2020, leaving too few workers to fill thousands of open jobs in the economy.
How can Minnesota grow its workforce to meet demand? Adding more people to the workforce must come from either increasing the share of existing Minnesotans who participate in the labor force, or by increasing the total number of working-age adults, which – given an aging population – must largely come from attracting more people to the state.
Neither of these have worked in Minnesota’s favor so far this decade.
The state’s labor force participation rate, while still among the highest in the nation, was nearly two percentage points lower at the end of 2023 than it was heading into the decade. After recovering some in the first three quarters last year, participation rates began falling again in the fourth quarter. Increasing labor force participation rates remains an imperative, but it may be difficult to pull large numbers of existing residents into the workforce since declining participation rates are due largely to an again population where more baby boomers are leaving the job market than younger workers are entering.
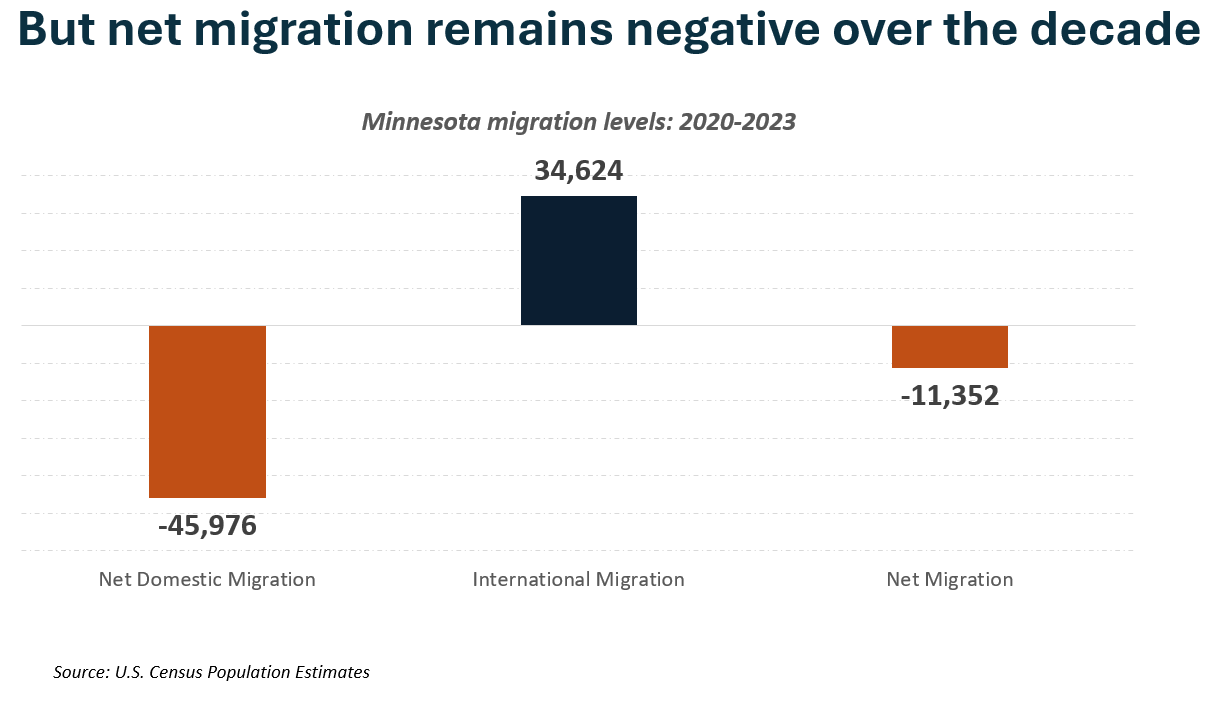
This leaves migration as a solution to Minnesota’s workforce shortages. This too has proven difficult in recent years. Domestic outmigration accelerated in the first three years of the decade while international migration slowed, giving Minnesota a total net migration of -11,352 from 2020-2023. The state ranked 43rd in net domestic migration during this timeframe, highlighting the severity of the challenge for Minnesota.
Yet, amidst these challenges are reasons for optimism.
First, tight labor markets have broadened workforce participation and reduced racial disparities in employment outcomes. Data from the Department of Employment and Economic Development (DEED) show that Minnesota’s black unemployment rate was 2.7% in December (on a 12-month rolling average), slightly lower than the overall unemployment rate of 2.9%.
Second, businesses have had to learn to do more with less, spurring productivity-generating practices that can lead to longer-term growth. This may include adopting new technologies and equipment as well as investing in workforce training to retain and upskill current employees. Such efficiencies are reflected in Minnesota’s productivity growth rate of 1.7% in 2022 (2nd highest nationally) and 2.1% from 2019-2022 (15th highest nationally).
Accelerating growth in Minnesota’s economy will require building on these positive trends while finding ways to add more people to the workforce in months and years to come.
How did Minnesota’s workforce change and grow over the past year? Below are five findings from the data.
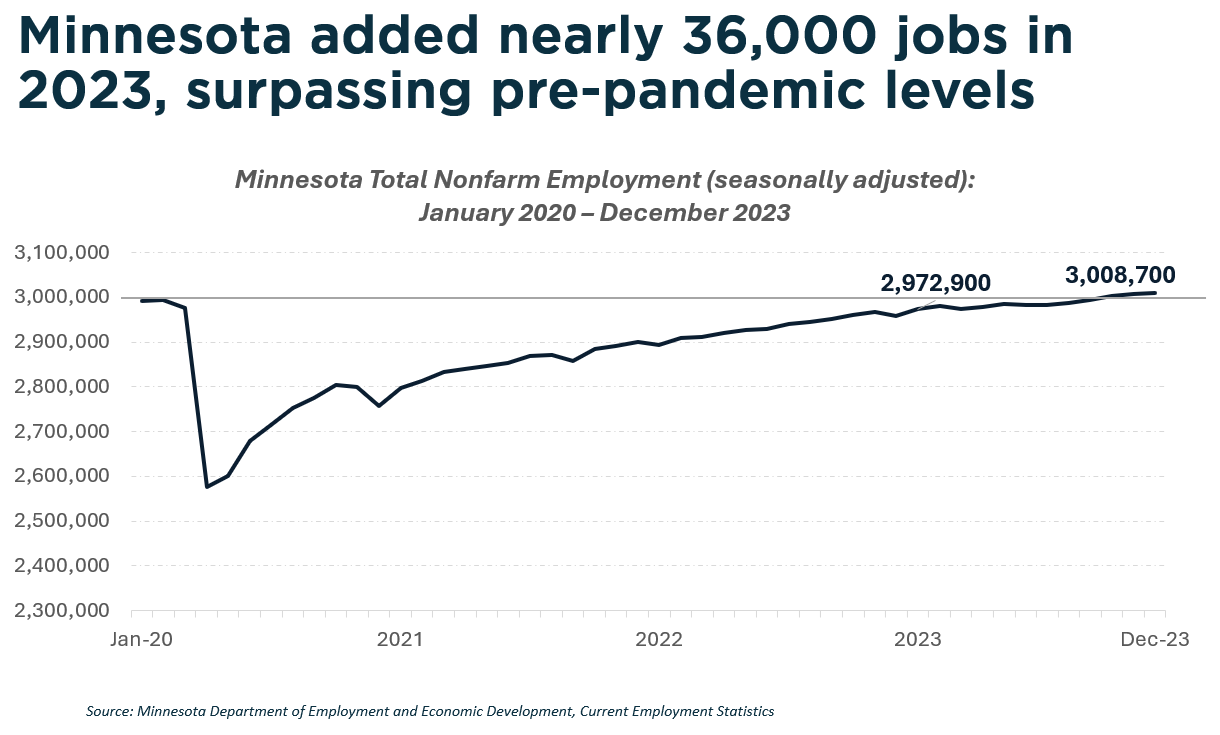
1. Job growth rose at a steady pace in 2023 but trailed the national average.
Minnesota employers added over 35,000 jobs and surpassed pre-pandemic employment levels as of September. Total nonfarm employment increased by 35,800 over the 12-month period and reached over 3 million jobs by December 2023. Last year also marked Minnesota’s full recovery from the steep job losses experienced in early 2020. The state surpassed pre-pandemic employment levels in September 2023 and ended the year with 17,500 more jobs than it had in January of 2020.
Despite these notable gains, however, job growth in the state continues to lag the national average. Minnesota trailed U.S. job growth rates in 2023 and ranked 37th among states in job growth over the decade from January 2020 – December 2023. Minnesota ranked 8th among the 12 states that make up the midwestern region in that time.
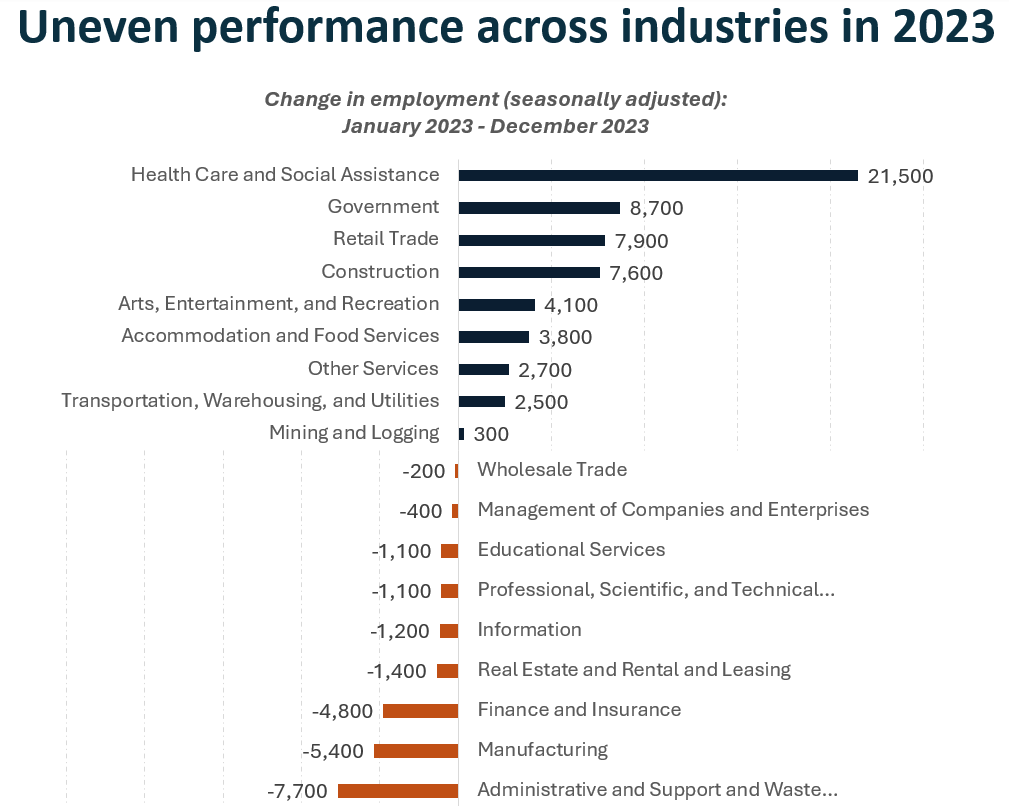
2. Job gains were concentrated in locally oriented industries in 2023, while tradable sectors like manufacturing and business services shed jobs.
Strong consumer spending propelled growth in the U.S. economy last year. These trends seem to reflect performance across Minnesota’s industry sectors as well, as locally oriented industries – which are tied more closely to consumer spending – outperformed tradable industries like manufacturing and office sectors like professional, scientific and technical services.
Current employment statistics data show that half of Minnesota’s major industry sectors added jobs in 2023. A common characteristic among most of these industries is that they primarily serve local markets in which the business establishment resides. Examples of these “local industries” include retail stores, restaurants, construction firms, entertainment venues and health care facilities.
Conversely, half of Minnesota’s major industry sectors experienced job losses last year. These losses were most pronounced in administrative and support and waste management and remediation (which includes temporary staffing agencies), manufacturing, and finance and insurance. Office sectors like real estate, professional services, and management of companies and enterprises (e.g., corporate headquarters) also struggled in 2023, combining to shed nearly 3,000 jobs.
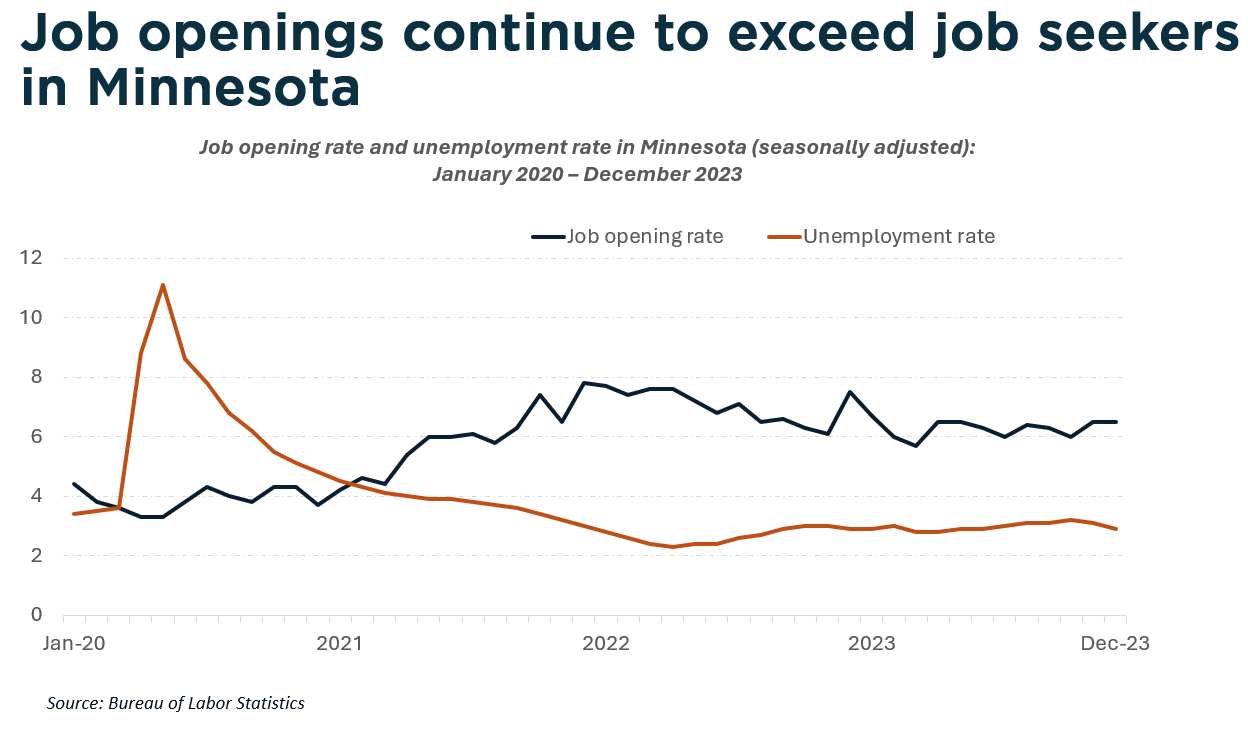
3. Minnesota’s labor market remains very tight with far more job openings than job seekers.
Minnesota’s unemployment rate remained low and remarkably steady over the past two years. The state’s seasonally adjusted unemployment rate was 2.9% in December 2023; the same rate as one year prior and just one tenth of a percentage point different than year before that.
Job openings continued to far outpace job seekers. An interactive map from the U.S. Chamber of Commerce shows that there were 0.51 job seekers for every one job opening as of September 2023.
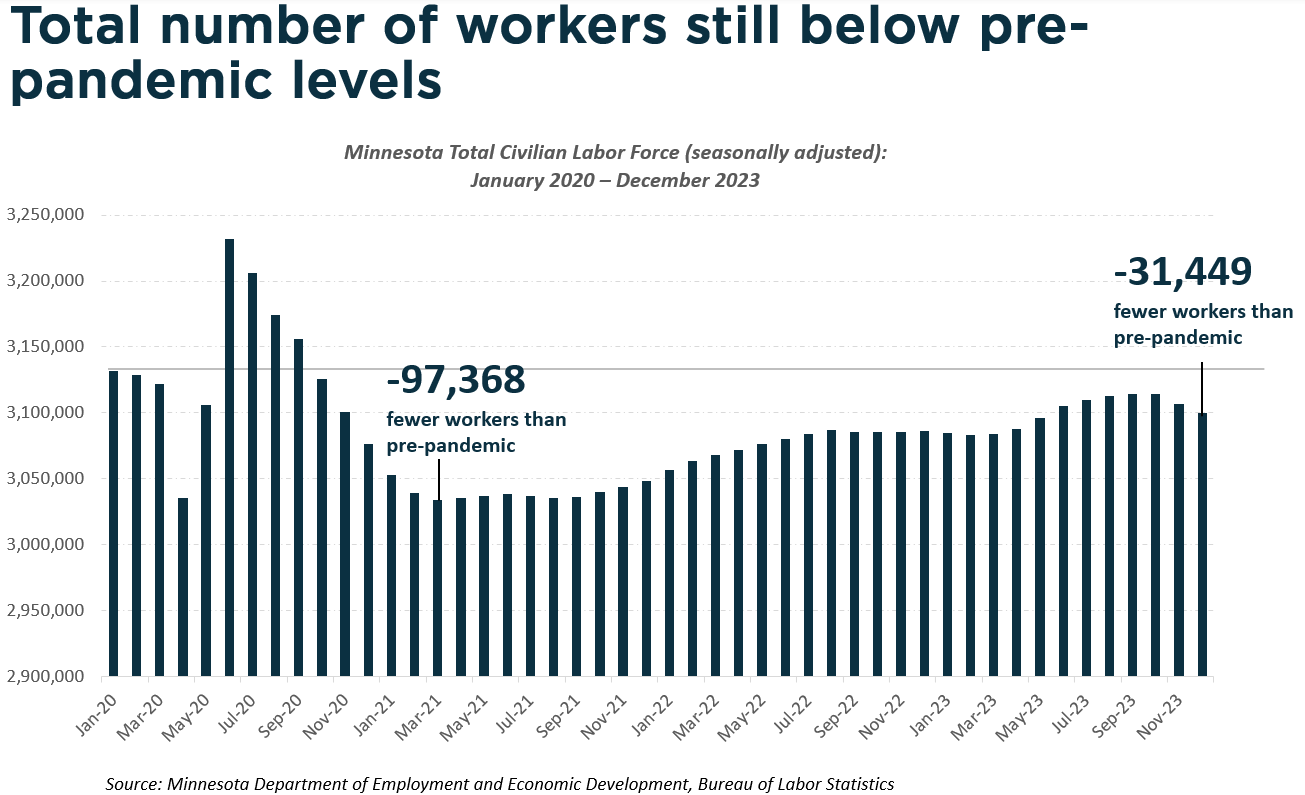
4. More Minnesotans entered the labor force in the first three quarters of 2023 but the number of workers fell in the fourth quarter, leaving Minnesota with 31,449 fewer workers in December 2023 than it had in January 2020.
Minnesota’s economy has grown this decade, but it has done so with fewer workers to produce goods and services. Over 97,000 individuals left the state’s workforce in the first year of the COVID-19 pandemic. Since then, Minnesota recovered around two-thirds of those missing workers, leaving the state with 31,449 fewer workers at the end of 2023 than it had at the beginning of 2020. Minnesota ranked 41st among states in labor force growth from January 2020 to January 2023, helping to explain the state’s below average economic growth in that time.
Despite the decline in available workers, however, Minnesota still had the 6th highest labor force participation rate as of December 2023, with 68.1% of adults over the age of sixteen working or actively seeking employment. This suggests that it may be difficult to pull large numbers of Minnesotans off the sidelines of the economy given its already-high participation rates.
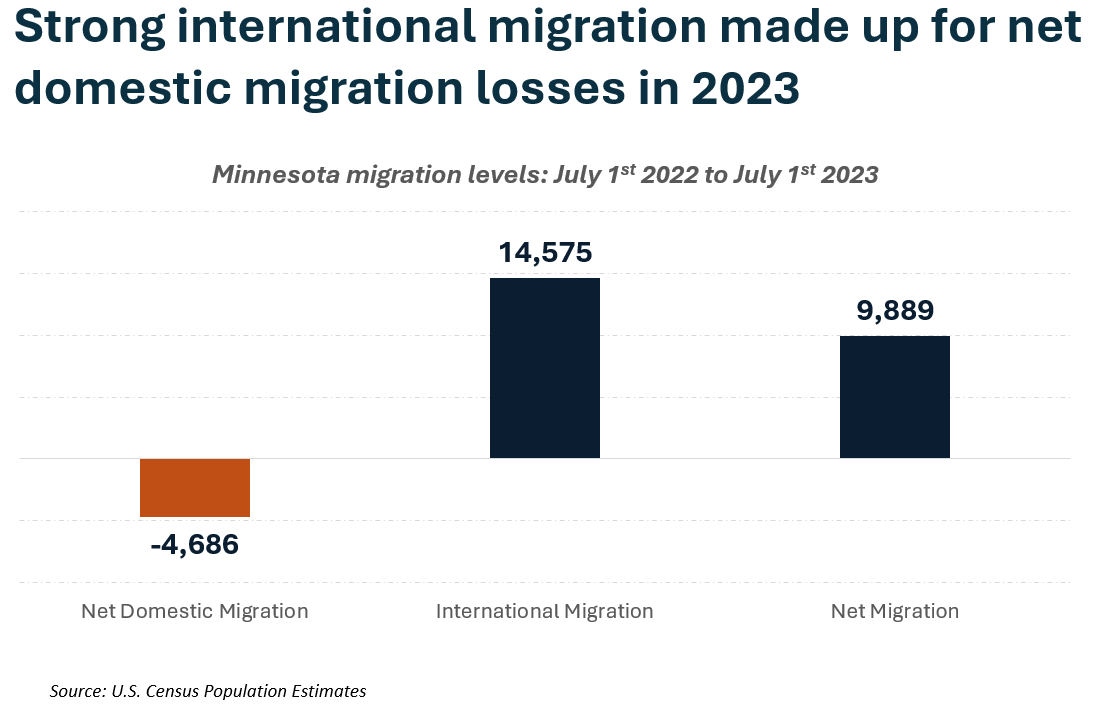
5. More people left Minnesota than moved here from other states again last year. But a rise in immigration bumped Minnesota into positive net migration levels overall.
Aside from boosting workforce participation rates among existing Minnesotans, the state can seek to grow its workforce by retaining and attracting more people. This has proven challenging in recent years. Minnesota ranked 43rd in net domestic migration from 2020-2023, with nearly 46,000 more people leaving than moving to the state. Minnesota experienced negative net migration with each of its neighboring states in 2022 (most recent year in which state-to-state migration flow data is available) and experienced the largest net losses to Florida, Texas and South Dakota.
Data from the U.S. Census Population Estimates show signs of improvement, however. For the first time this decade, Minnesota experienced overall net migration gains as a rise in immigration made up for net domestic migration losses. This puts Minnesota closer to its pre-pandemic trend, where the state combined robust immigration with negative domestic migration.
Further research is needed to better understand the implications of these trends to the state’s workforce by identifying the characteristics of those who are coming and leaving. The Minnesota Chamber Foundation plans to release a report on this topic later in 2024.
Want to learn more about Minnesota's economy?
Minnesota: 2030 – 2023 Edition builds on the original Minnesota: 2030 report. It provides an in-depth analysis of Minnesota’s economic performance since the pandemic and revised economic forecasts. The report builds on the original recommendations for growth and highlights some priority strategies moving forward.
SHARE
Recommended Articles