Looking beneath the aggregate data

Minnesota entrepreneurship by sector, region, demographics
Statewide data provide a high-level view of entrepreneurship in Minnesota, but they do not fully account for the variations in entrepreneurial activity that occur across Minnesota’s diverse regions, industries and demographic groups. This section reviews some key highlights of differences and similarities in Minnesota’s entrepreneurial landscape as we look beneath the aggregate data.
Sector analysis: Minnesota’s industry structure is geared toward lower volume, higher value firm creation.
Startup activity varies significantly by sector. Understanding these differences can provide critical insights regarding the underlying dynamics that influence entrepreneurship trends in Minnesota.
Minnesota’s economy is underrepresented in the industries with the highest startup rates. That may not be a bad thing.
Numerous factors influence state-to-state variation in business formation, including population growth, firm concentration, and education levels, among others. Breaking down employer startup levels by sector suggests that economic structure (i.e. the distribution of jobs and firms across sectors) may also play a role and help explain why states like Minnesota consistently trail in overall startup rates.
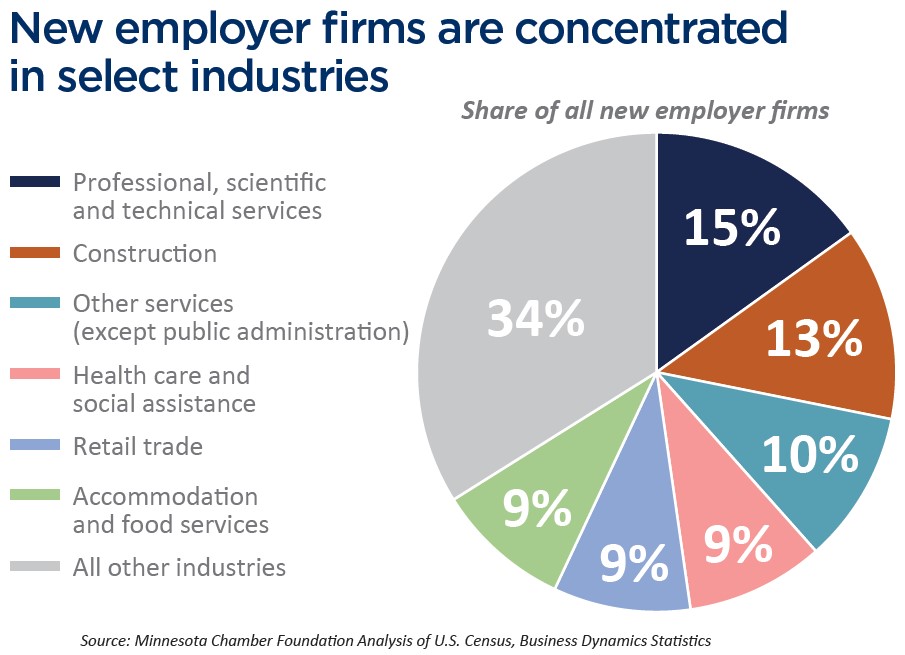
New employer startups are concentrated in just a handful of industries. Six industries account for two-thirds of all new startups, and just three of those account for nearly half of all startup job creation. Not surprisingly, these industries are generally less capital-intensive and face comparatively lower barriers to entry. These industries are also heavily comprised of small businesses.
Minnesota has a below-average concentration of jobs relative to the U.S. economy in five of the six industries that drive startup formation each year. Minnesota’s economy simply is less concentrated in industries like restaurants, professional services, construction, and retail – all of which are responsible for a high share of new business formation. Health care and social assistance is the only industry with both high startup rates and above-average job concentration levels in Minnesota relative to the U.S. economy.
This tells only half the story, however. Small business-intensive industries are not necessarily the ones most likely to drive innovation and growth, though their prevalence makes them still-strong contributors to the economy. Rather, high growth-potential startups may be more likely to occur in technology, financial, medical and industrial sectors. These dynamics play to Minnesota’s existing industry strengths.
Minnesota has high concentrations of activity in sectors such as finance and insurance, health care and medical technology, manufacturing (including high-tech subsectors like electronic instruments and machinery), food and agriculture and wholesale trade, as well as in corporate services subsectors such as marketing and advertising – all of which produce lower numbers of new companies but have high potential value creation.
Minnesota also has the highest concentration of management of companies and enterprises (i.e. corporate headquarters) jobs in the U.S., which – though not responsible for many new startups directly – plays an important role for high growth-potential startups in a variety of ways, including through involvement in accelerator programs, mentoring for founders, procurement programs, and direct investment through corporate VC funds. Minnesota’s large enterprises also contribute to the state’s overall talent pool and can generate new startups through employees who leave their job to start their own venture or through corporate spin-off activities. Many innovative businesses in Minnesota today originated from other existing firms, playing a role in the development of several notable industry clusters.
Minnesota 2030: A framework for economic growth – a report released by the Minnesota Chamber Foundation in 2021 – argued that these historical strengths give Minnesota a competitive advantage in emerging sectors where new technologies and innovations are being applied to mature industries.
A review of recent venture capital activity suggests that his opportunity may be becoming reality.
Minnesota startups are nationally competitive across a range of verticals; health care and medical innovation remain core strengths.
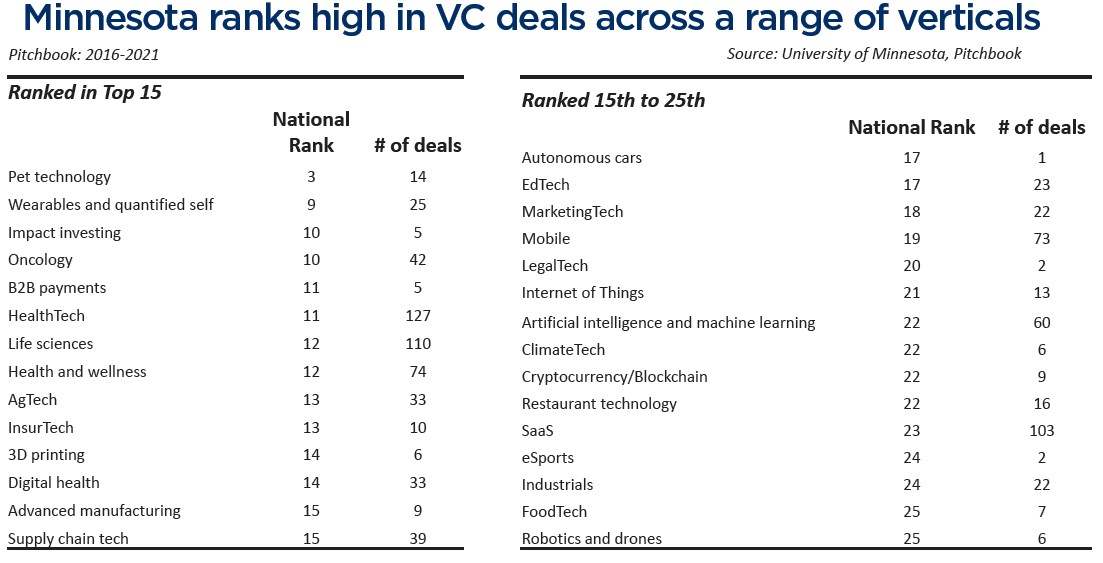
Minnesota startups raised venture capital across a wide range of industries over the past five years. Venture capital deals in Minnesota spanned 23 industries and 45 verticals since 2019, according to data from Pitchbook. Further, Minnesota ranked among the top half of states for VC deal flow in 30 different verticals from 2016-2021.
Deal flow for Minnesota startups ranks among the top half of states in wide-ranging activities such as agtech, advanced manufacturing, 3D printing, B2B payments, edtech, IoT, wearables, supply chain tech, artificial intelligence and machine learning, and marketing tech, among others.
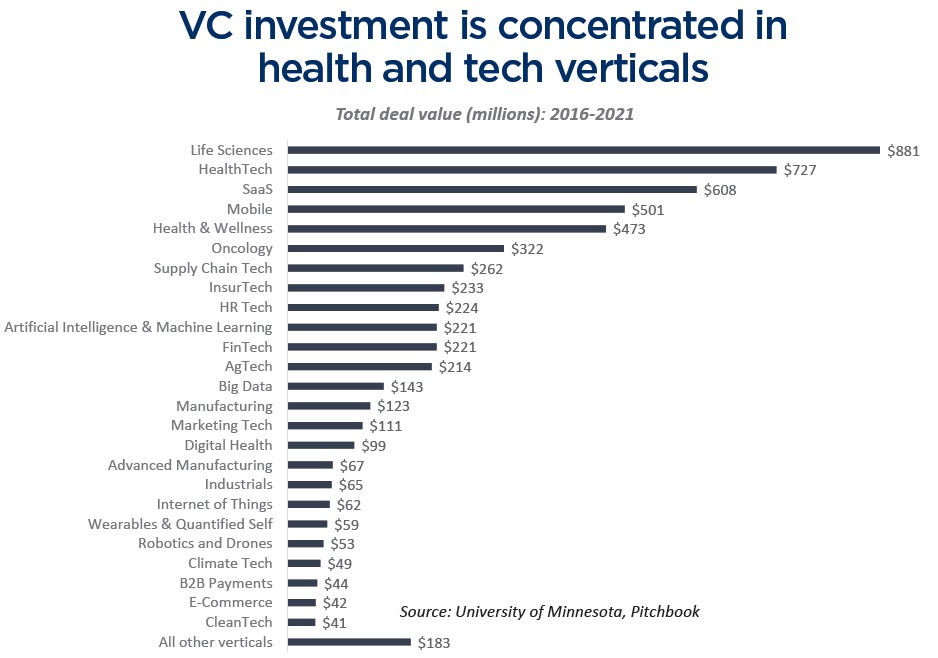
Importantly, Minnesota ranks in the middle of the pack or better in some of the verticals driving venture capital investment nationally, including software-as-a-service (SaaS), fintech and mobile. Insights from local venture capital fund leaders reflect this perception as well: Minnesota can build successful companies across the board, not just in one or two industries.
At the same time, health-and medical-related fields continue to be key drivers for high-growth startup activity in Minnesota. Minnesota’s venture capital deals are concentrated in a range of health verticals, from health tech and life sciences to digital health, oncology, and health and wellness. The state ranks in the top 15 across these verticals, demonstrating its outsized influence on medical innovation in the U.S. Together, Minnesota’s health and medical startups have raised $1.1 billion in venture capital since 2019.
Health care startups are also finding investment outside of private capital markets. As Medical Alley notes, the sector is diversifying its sources of capital through public markets and government grant funding. Federal investment vehicles like the Small Business Innovation Research (SBIR) and Small Business Technology Transfer (STTR) programs provide early-stage funding for products that may take years to get to market. Minnesota health companies are increasingly leveraging this source to fund early-stage activities. Additionally, some young companies are even raising growth capital directly through public
In short, evidence suggests that Minnesota’s economic diversity is playing a role in the next wave of high growth-potential startups, with health and medical innovation firms leading the way. At the same time, Minnesota faces steep competition nationally and globally in these fields. Continuing to support startups broadly while addressing specific needs of individual sectors will remain important going forward.
Regional analysis: Startups are forming in areas with greater population density. However, changes during the pandemic may offer new opportunities for rural communities in Minnesota.
Minnesota has a legacy of starting and sustaining leading companies in communities across the state. Yet changing demographics, technological shifts and a global pandemic are reshaping the contours of the state’s economy, presenting both challenges and opportunities to build on regional entrepreneurship strengths in the years to come.
Startup activity is concentrated in the Twin Cities and denser regions of the state. New businesses play an important role across the state.
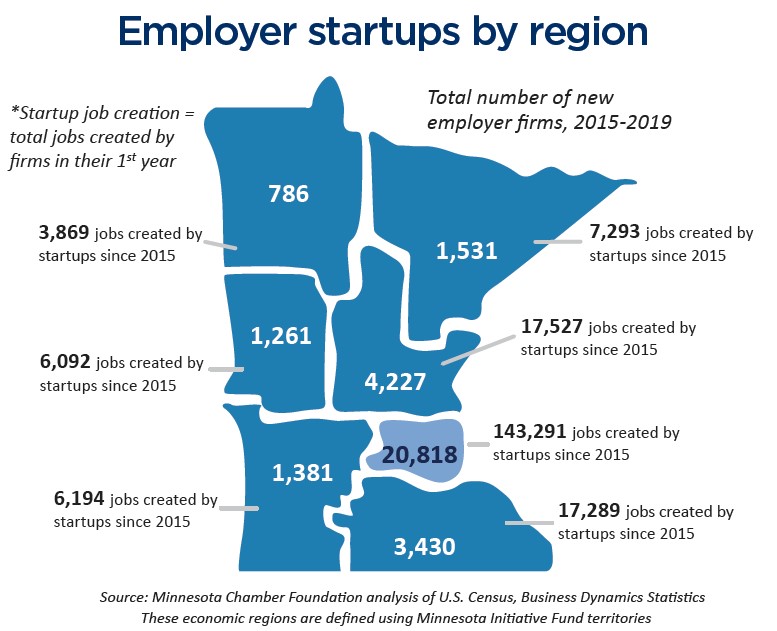
However, startup activity is uneven across regions, with the state’s denser, urban areas making up an outsized share of new employer businesses and startup job creation. The Twin Cities seven-county metro makes up 55% of the state’s population but produces 62% of all Minnesota new employer startups. The Twin Cities was also the only region to see relatively consistent gains in startup job creation levels between 2010 and 2019.
Outside of the Twin Cities metro, more densely populated regions such as Central and Southeast Minnesota saw modest gains in new employer firms from 2010 to 2016, before leveling off in the following years. Overall, just more than half of all counties in Minnesota saw gains in the total number of employer startups since 2010, while 42 counties experienced an absolute decline.
Similar regional changes are evident in nonemployer businesses over time. The total number of businesses without paid employees increased by 11% in the Twin Cities metro from 2012 to 2018, while increasing by just 2% in Greater Minnesota. Yet, nonemployer business revenue is relatively even across many regions, with five of seven regions averaging between $47,000 and $49,000 per nonemployer business annually. In other words, growth in the number of nonemployer businesses is lagging in Greater Minnesota, but solo entrepreneurs perform similarly across most regions of the state.
Recent indicators of growing entrepreneurship in Greater Minnesota:
New business applications surged in 2020 and 2021, signaling new opportunities to support startup growth in the state. This spike in entrepreneurial interest occurred widely across Minnesota’s regions.
Fifty-nine of Minnesota’s 87 counties saw an increase in business applications from 2019 to 2020. And while the increase was largest in the Twin Cities metro, counties in Greater Minnesota such as Renville, Steele, Goodhue and Mille Lacs had among the highest growth rates in new business applications statewide. In fact, the top five counties with the largest percent increases in new business applications all occurred outside the seven-county metro in 2020.
While this represents only a small fraction of total statewide business applications, the widespread surge in planned business starts is notable given recent disparities between denser and more rural areas of the state. Additionally, new initiatives are forming around the state to better support and fund entrepreneurs in Greater Minnesota. Many of these efforts are still in their early stages, but the proliferation of entrepreneurial support services provides an underlying infrastructure to catalyze new business growth outside of major metro areas.
Demographic analysis: BIPOC-owned businesses remain underrepresented in Minnesota’s economy. But they are growing at a fast rate and outperforming peer businesses of color in the U.S.
Entrepreneurship presents an important pathway to economic mobility and flourishing for Minnesota’s BIPOC communities. As Minnesota 2030: A framework for economic growth argues, making workforce inclusion a strength in Minnesota is both a moral and economic imperative. Communities of color are driving population growth in the state and will continue to do so in coming decades. Yet, disparities remain across a range of social and economic indicators. It is critical to understand how the demographic makeup of Minnesota’s business community is changing, and what can be done to accelerate inclusive entrepreneurship in the state.
Data from the U.S. Census reveal several important insights.
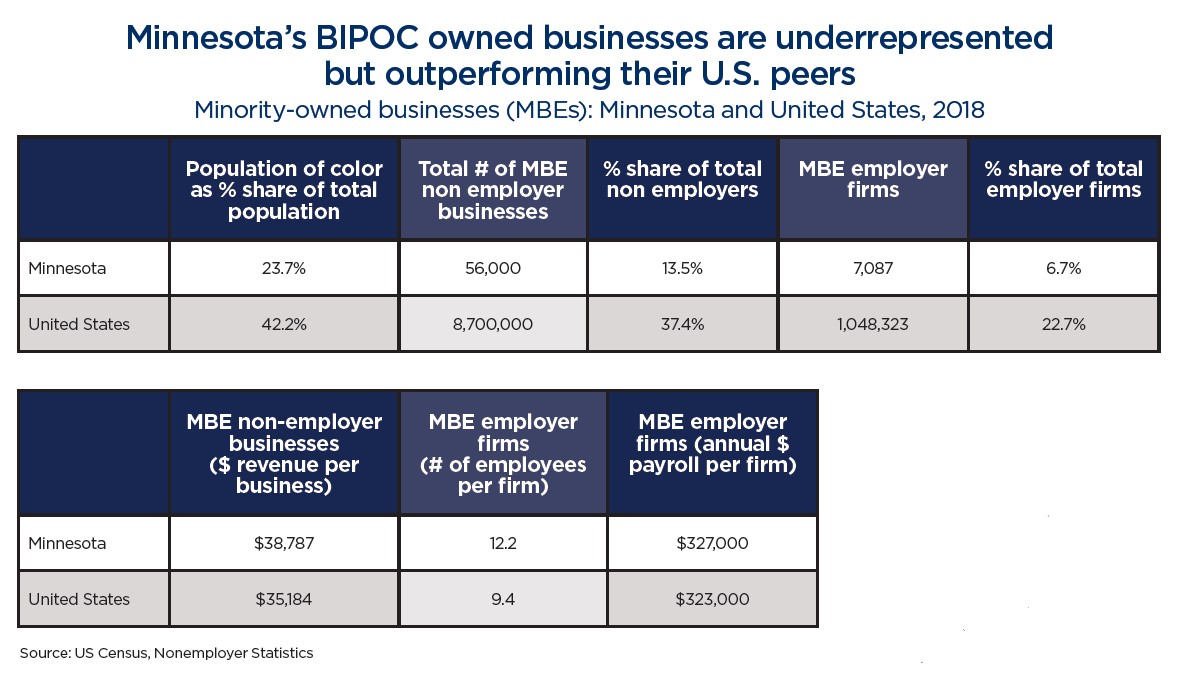
First, BIPOC entrepreneurs remain underrepresented in Minnesota’s economy. People of color make up 23.7% of Minnesota’s population but just 13.5% of all nonemployer business owners and 6.7% of employer firm owners. As noted in the Minnesota Chamber Foundation’s 2021 report, The Economic Contributions of Immigrants in Minnesota, this may be due in part to the state’s lagging entrepreneurship rates for immigrants. Immigrants in the U.S. are more likely to be self-employed than native-born individuals, but the opposite is true in Minnesota. Only 3.7% of foreign-born Minnesotans are self-employed compared to 5.4% for the state’s native-born population.
Despite their continued underrepresentation, however, BIPOC-owned businesses are growing at a fast rate and make up a larger share of all Minnesota businesses over time. In 2012, Minnesota had 47,565 minority-owned businesses, making up 9.7% of all firms in the state. But by 2018, Minnesota had added a net 15,522 minority-owned businesses, reaching a total of 63,097 firms and making up 12.3% of all Minnesota businesses. This growth occurred among both employer and nonemployer businesses, with minority-owned employer firms increasing by 25.4% and minority-owned nonemployers increasing by 33.6% in that time.
Second, total employment and revenue among BIPOC-owned businesses grew in recent years. In 2018, BIPOC-owned businesses employed over 87,000 people and generated $2.3 billion in payroll, up from 63,360 employees and $1.7 billion total payroll in 2012. Similarly, revenue for nonemployer businesses of color grew from $23,000 per business in 2012 to $39,000 per business in 2018. While this remains below the average revenues for white-owned nonemployer businesses, minority-owned businesses closed this this gap by over $15,000 per business since 2012.
Third, Minnesota’s entrepreneurs of color are outperforming minority-owned businesses in the U.S. In 2018, Minnesota’s minority-owned employer businesses had three more employees per firm and paid out an average of $4,000 more in annual payroll than MBE employers in the U.S. as a whole. Further, Minnesota’s nonemployer businesses of color generated $39,000 per business compared to just $35,000 nationally.
So, while racial disparities remain among Minnesota’s entrepreneurs, the state’s BIPOC-owned businesses are becoming more numerous and outperforming peer businesses on the national stage.
This momentum appears to have continued since 2020. Leaders from business support organizations revealed that inquiries and demand for services from BIPOC entrepreneurs accelerated during the pandemic. This has occurred alongside a growing number of programs and resources to support BIPOC-owned businesses. Both the data and anecdotal evidence underscore the importance of taking further measures to build on recent momentum and unlock the economic potential of Minnesota’s diverse entrepreneurial community.
Similar dynamics exist for women-owned enterprises (WBEs) in Minnesota. In 2018, women-owned businesses accounted for 35% of all Minnesota firms (employer and nonemployer), with another 5% being part-owned by a female owner. Women are much less likely to own a business with paid employees than their male counterparts. WBEs made up just 18% of all employer firms in the state compared to 40% of all nonemployer businesses. Nonemployer firms are smaller and generate far less revenue than employer firms on average. This is especially true for women. Women nonemployer businesses averaged just $26,626 in annual sales in 2018 compared to $56,965 for male nonemployers.
Minnesota trails the U.S. slightly in women-owned business representation. However, WBEs in Minnesota are larger on average than their U.S. counterparts, with Minnesota women-owned businesses averaging nearly three more employees per firm and over $62,000 more in annual payroll. Research from the Women’s Foundation of Minnesota also shows that Minnesota was ranked first in the U.S. in employment vitality, an indicator that measures the “employment growth rate of womenowned businesses (2007 to 2018) and the average number of employees per women-owned business.”
Like minority-owned businesses in Minnesota, women entrepreneurs continue to be underrepresented but perform well compared to WBEs in the U.S. economy.
Navigate the report


DOWNLOAD THE REPORT