Contributions change over time
Contributions change over time
Over time, immigrants in Minnesota are upwardly mobile, including improved poverty, unemployment and homeownership rates, all of which help increase their contributions to the economy.
Specific case studies of immigrant groups in Minnesota (Somali-and Mexican-born) demonstrate the American Dream is alive and well in the state with many socioeconomic indicators improving with time.
Many immigrants, particularly refugees and asylees, access taxpayer-funded education, health care and public assistance programs at high rates when they first arrive, however, over time their economic contributions outweigh these upfront costs.
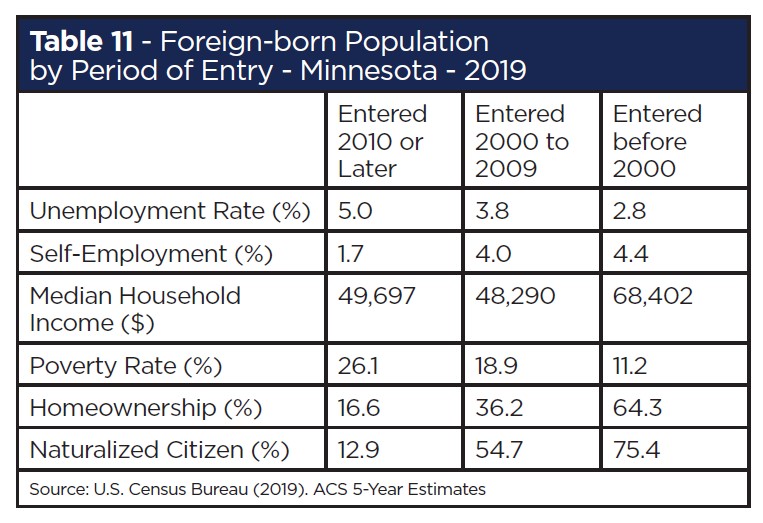
Over time, immigrants in Minnesota are upwardly mobile on multiple fronts. Table 11 shows the top socioeconomic indicators used to evaluate upward social mobility. Foreign-born workers are unemployed at lower rates the longer they are in the country and more foreign-born workers end up working for themselves over time. Immigrants who have been in the country for longer periods of time have higher median household income and lower poverty rates than recent immigrants. They purchase homes at much higher rates than immigrants who entered the country recently. And the longer an immigrant has been in the country, the more likely they are to become a naturalized citizen.
Case studies
The American Dream is built on the promise of upward social mobility and the opportunity to prosper. This ideal is alive and well for immigrants in Minnesota. Immigrants and refugees arrive at varying socioeconomic levels with a variety of skills and abilities. As time passes, immigrants develop new skills, join the workforce, attain higher levels of education and buy homes— increasing their economic contributions. Case studies of Somali and Mexican-born immigrants in Minnesota demonstrate these changes over time and illustrate success and economic impact. An additional case study on the Hmong population in Minnesota is available in the previous iteration of this report.
Somali Immigrants in Minnesota
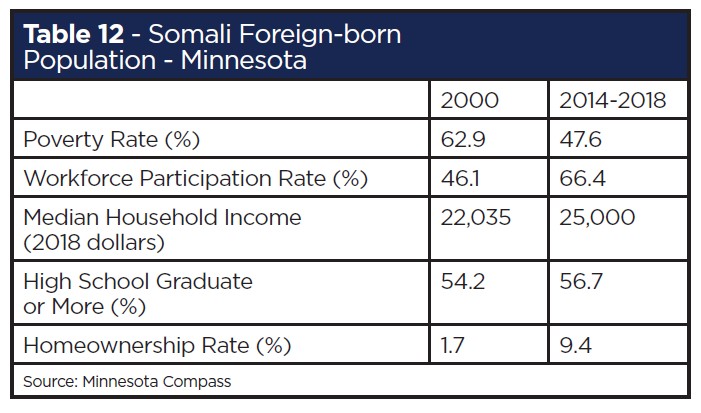
Beginning in the early 1990s, Somali refugees moved to Minnesota fleeing extreme violence as a result of the collapse of the Somali government. As of 2019, Minnesota had the largest Somali population in the U.S. Currently, Minnesota’s foreign-born Somali population totals 36,495,70 the vast majority of whom (~77%) reside in the Twin Cities metro area. While many Somali refugees arrived with limited education, low workforce participation rates and high poverty levels, their situation two decades later has shifted significantly. Poverty levels have dropped, workforce participation has increased, median household income has ticked up and educational attainment has made marginal gains (table 12). The percentage of Somali homeowners has also increased. One of the major industries for Somali employment is home health care services, with over 15% of all Somali immigrants in Minnesota working in this industry. Somali workers have also become a vital part of the state’s food manufacturing industry. There are over 2,000 Somali workers in the animal food processing subsector, comprising 11% of total workers. The entrepreneurship rate among Somali immigrants is relatively low and is nearly identical to the rate for the broader foreign-born population statewide.
Mexican Immigrants in Minnesota
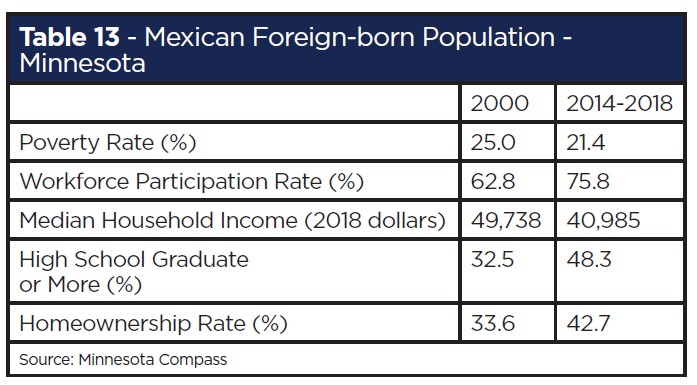
Mexican immigrants have resided in Minnesota longer than most other immigrant groups. They now make up over half of the Latin American foreign-born population in our state, with one in seven immigrants from Mexico.74 Currently, Minnesota has a foreign-born Mexican population of 62,597. Hennepin and Ramsey Counties have the largest populations of Mexican immigrants. Many Mexican immigrants are drawn to these areas by the prospect of employment opportunities and family connections. The majority of Minnesota’s Mexican immigrants have been in the country for 16 years or more and speak English well or very well. Only about 10% reported not speaking English at all. Minnesota’s foreign-born Mexican population has also shown a positive trend on a number of socio-economic indicators (table 13). Improvements in poverty rate, high school graduation rate and homeownership underpin this trend. In addition, the workforce participation rate has improved tremendously and now surpasses the native- and foreign-born rates for those state populations. Only the median household income has shown a negative trend over the last two decades. Minnesota’s Mexican-born population is hardworking, holding jobs few others are willing to do and sometimes holding more than one job. The largest percentage of Mexican-born workers is in the restaurant and food service industry (almost 17%). Entrepreneurship is another bright spot for Mexican-born immigrants. Their entrepreneurship rate is almost two percentage points higher than the rest of the foreign-born population in Minnesota.

Costs of Immigrants
When evaluating the impact over time of immigrants on Minnesota’s economy, it is important to consider associated costs. These are typically higher in the short term as immigrants establish their home and work situations, lessening over time. The contributions they bring to the economy, however, are greater in the long term.
The primary costs associated with immigrants include education, health care and basic public assistance programs. An increase in immigrants brings an increase in immigrant children, who typically attend publicly-funded schools. While immigrant children may require English language classes which increase costs, they make up a very small percentage of all children enrolled in K-12 schools in the state (~5%). The increase is nowhere near the drain on public education that many opponents claim, and the long-term benefits of a well-educated workforce are substantial. In addition, an influx of school children has enabled some school districts with previously declining enrollment from native-born populations to stay viable without consolidation of districts across large areas.
Health care is often cited as a major cost burden for states with high levels of immigrants. Refugees and asylees, two immigrant groups with sizable populations in Minnesota, do require significant levels of public health assistance. Typically, these are short-term costs associated with the fresh trauma or stress experienced in areas from which they are fleeing. National studies show that non-citizens actually use fewer health care resources than citizens over time. The Minneapolis Foundation presented an explanation for this difference in consumption, “In general, the more limited consumption of health care resources by immigrants is attributed to the many barriers they face accessing the traditional health care system – including relatively low rates of insurance, ineligibility for certain public health programs, and linguistic and cultural barriers which can make the health care system confusing and difficult to navigate.” Minnesota has a large number of refugees, and the Minnesota Refugee Health Program provides services to a portion of this population, but not its entirety.
Foreign-born populations in Minnesota have higher rates of poverty than native-born populations which leads to a heavy reliance on public assistance programs such as Food Stamps or Supplemental Security Income. Nearly three times as many foreign-born residents use Food Stamps compared to the native-born residents. The vast majority of public assistance payments through public health care, cash and food assistance in Minnesota is to refugees, asylees and lawful permanent residents, all of whom pay taxes in the state of Minnesota. Unauthorized immigrants’ access to taxpayer-funded programs in Minnesota is extremely limited.
Unauthorized immigrants and temporary residents such as students, tourists or visitors are the most restricted, with “access only to Emergency Medical Assistance and coverage of services through the end of pregnancy,” according to the Minneapolis Foundation. In reality, this group doesn’t represent a significant cost or burden to the taxpayer’s bottom line.
With support from The McKnight Foundation![]()
Navigate the report


SHARE
Recommended Articles