Economic contributions—Consumers, human capital, taxpayers, link to the world economy
Economic contributions
-
Immigrants’ spending power is over $12.4 billion annually, while households paid $4.5 billion in taxes in 2019.
-
Immigrants in Minnesota have higher rates of labor force participation than the native-born population.
-
Minnesota’s workforce is increasingly made up of foreign-born workers. Educational attainment among immigrants is concentrated on the far ends of the spectrum, while educational attainment among the native-born population is concentrated in the middle, allowing immigrants to complement the native-born workforce well.
-
Immigrants are an important link to the world economy.
There are a number of ways to analyze the economic and multidimensional contributions of immigrants to the development of Minnesota’s economy. In this analysis, immigrants’ impacts are measured by their role in the economy as consumers, sources of human capital, taxpayers, entrepreneurs and by facilitating connections to global markets.
Consumers
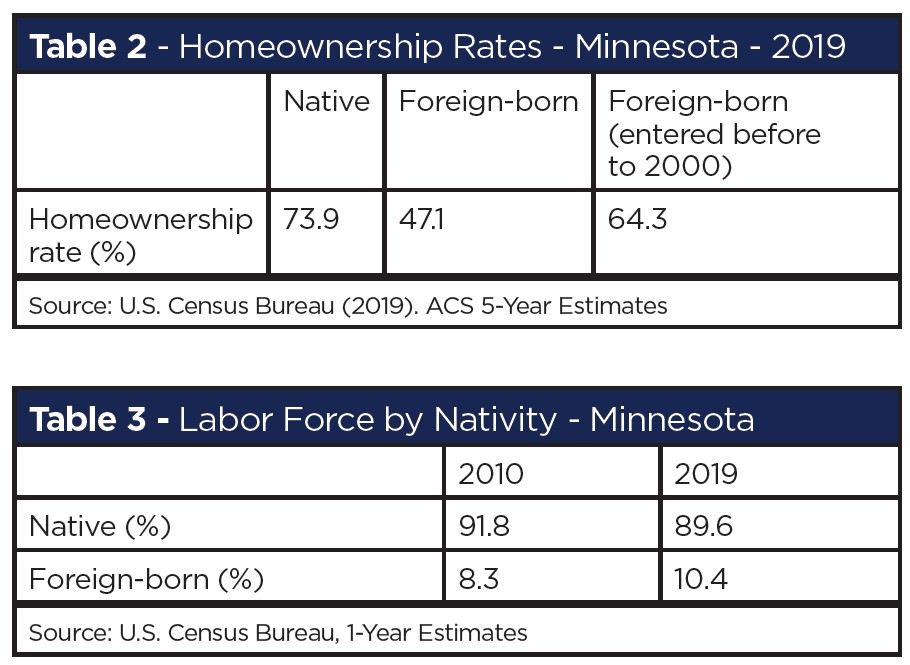
As consumers, immigrants play an important role in the economy through the purchase of goods and services. Immigrants wield $12.4 billion in spending power in Minnesota. This number is more than double than in 2013, when their spending power was estimated around $5 billion. This after-tax income is used to support existing businesses throughout communities and the creation of new businesses that meet immigrant consumers’ needs, tastes and preferences. Spending power also stimulates local housing and rental markets. Homeownership represents the purchase of most Minnesotans’ single largest asset. Owning a home helps contribute to wealth accumulation over time. Recent immigrants, however, are more likely to be rent-burdened and will spend a higher proportion of their income on goods and services instead of purchasing a home. This is not a permanent feature though: the longer an immigrant household is in the U.S., the more likely they are to own a home and start accumulating wealth (table 2). The foreign-born population does not purchase homes at the same rates as the native-born population until many years after arriving in the U.S. Buying a home is a tremendous step forward for any citizen and represents putting down roots in a community. This is no different for the foreign-born population.
Human capital
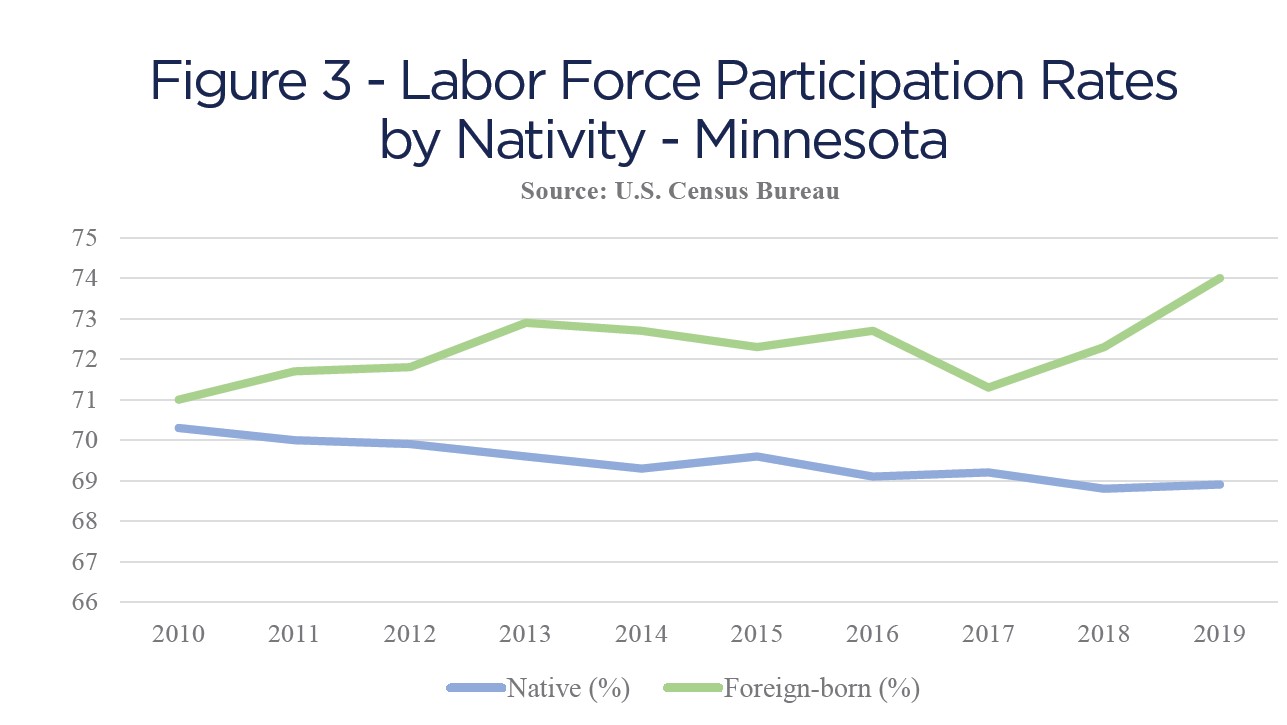
A healthy supply of labor is essential to keeping Minnesota’s economy running smoothly. “Tight labor markets and a growing scarcity of workers” are now recognized as two barriers to growth in Minnesota’s economy. Immigrants play a large role in addressing these human capital needs. Since the 1980s, the foreign-born percentage of Minnesota’s workforce has grown from 2% to over 10%. The current total number of immigrants in the workforce is 315,308. Nationally, there are 28.4 million foreign-born workers in the labor force representing 17% of the total. In Minnesota, the foreign-born percentage of the labor force is 10.4% (table 3). Additionally, labor force participation rates among immigrants are higher than among native-born workers, a trend that has grown over the last decade (figure 3). Shrinking labor force participation rates among the native-born Minnesota population creates challenges to Minnesota’s economic growth and expansion. Nationally, labor force participation rates are trending up for both foreign- and native-born workers.
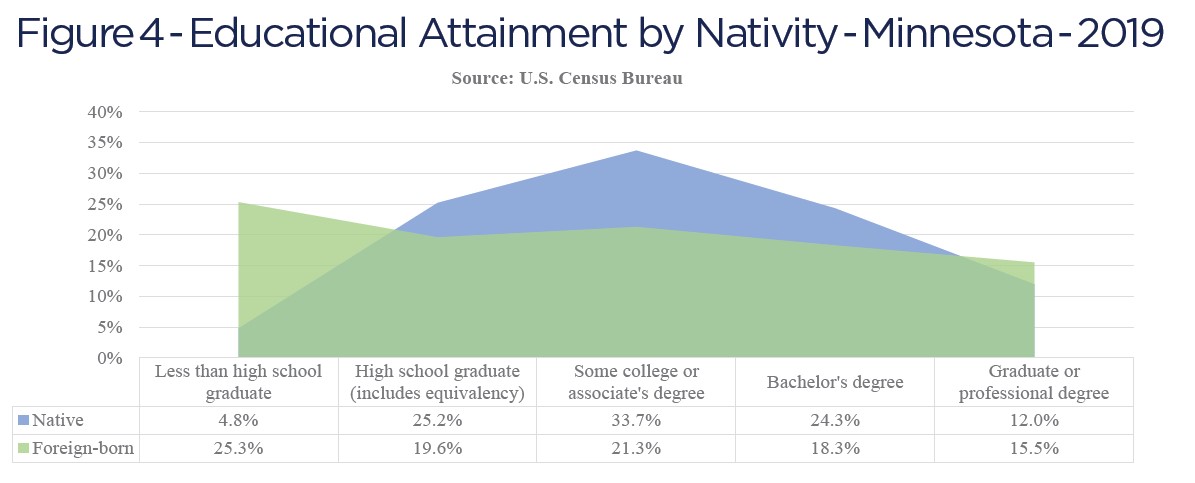
Figure 4 shows that foreign-born workers tend to fall on the far ends of the educational attainment spectrum. Higher percentages of foreign-born workers are clustered in the “less than high school degree” category and the “graduate and or professional degree” category than native-born workers. This complements our native-born workforce and helps supply employees where needed.
Much like national trends, Minnesota’s foreign-born workers are more likely to work in service occupations and production, transportation, material moving occupations than their native-born counterparts (table 4), comprising more than 20% of the total workforce in each of these occupation categories. Immigrants are less likely to work in management, professional and related occupations and/or in sales and office occupations.
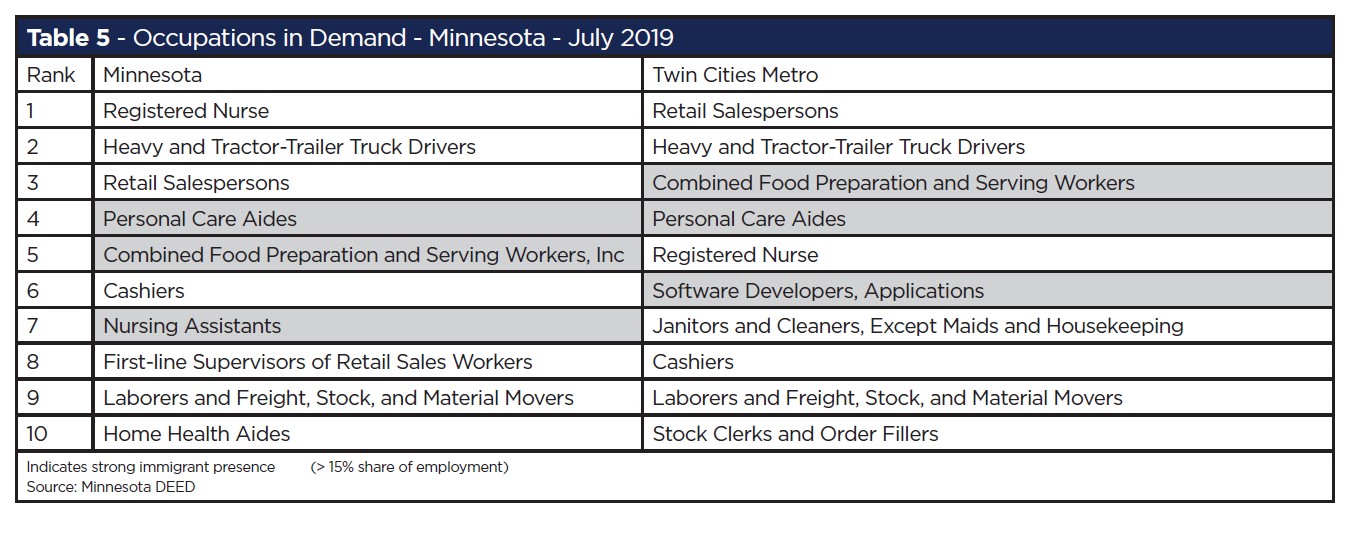
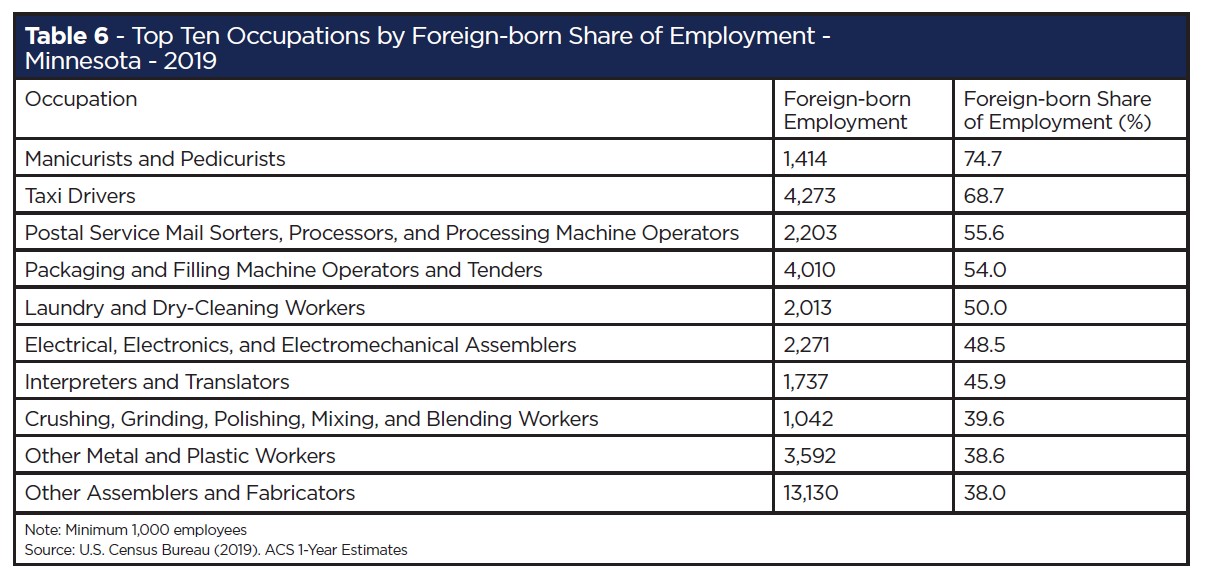
Table 5 outlines the top 10 occupations in demand in Minnesota and the Twin Cities metro area. Of the top 10 occupations in demand statewide,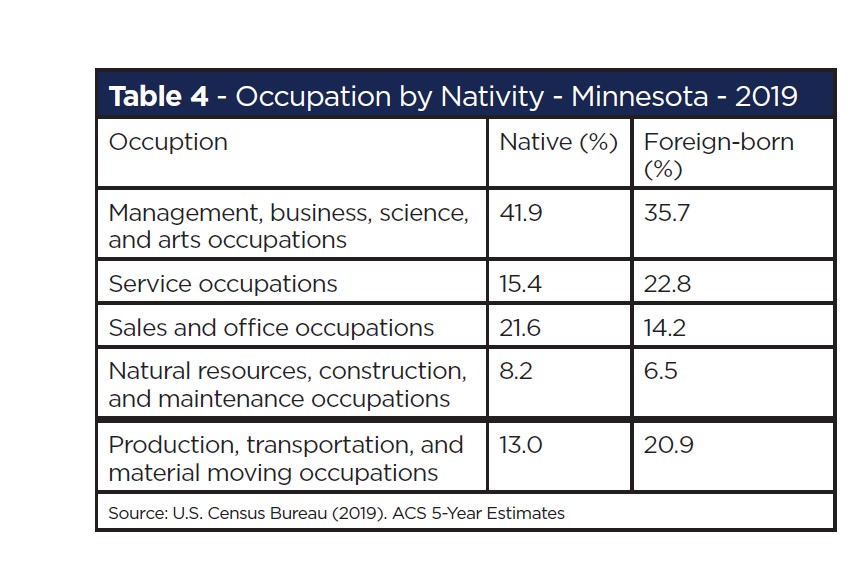 three have a strong presence of immigrant workers (personal care aides, food preparation and service, and nursing aides). The most in-demand occupation as of July 2019 was registered nurses, comprising 8% of foreign-born workers. Three of the top 10 occupations in the Twin Cities metro area have a strong immigrant presence. Table 6 shows the top 10 occupations employing foreign-born workers by share of employment in Minnesota in 2019. Some occupations with large shares of foreign-born employment include highly specialized fields such as engineers and scientists, which require greater levels of educational attainment. This specialization makes employment numbers incredibly small and shows that employers frequently turn to immigrants to fill these positions. For example, of the 188 petroleum, mining and geological engineers, and the 105 nuclear medicine technologists in Minnesota, 76% and 82% respectively are foreign-born. For a list of high-skill occupations with large shares of foreign-born employment, see Appendix Table A3. High-skilled workers are in tremendous demand in Minnesota. H-1B visas are reserved for immigrant workers in specialty occupations who hold at least a bachelor’s degree. One of the first steps in applying for an H-1B visa is to submit a Labor Condition Application (LCA) to the U.S. Department of Labor. Businesses in Minnesota submitted nearly 11,000 LCAs in fiscal year 2018, which ranks 15th among all U.S. states. Many Minnesota businesses require specialized talent and many universities apply for H-1B visas to bring specialized academic capability to the state. The University of Minnesota, for example, submitted 266 LCAs in fiscal year 2018. Minnesota’s diverse economy has a breadth of needs for the skills and expertise that immigrants provide. Analysis of this critical component to Minnesota’s economy will be addressed later in the report and includes interviews with stakeholders among some of the state’s key industries.
Taxpayers
One of the major contributions immigrants make to the economy is in the form of taxes. Immigrants pay sales tax, property tax, payroll tax and others, which benefits all Minnesotans. Immigrant households in the state paid $4.5 billion in taxes in 2019: $2 billion in state and local taxes, and $2.5 billion in federal taxes. These tax dollars helped support public education, health care and safety throughout the community. Estimates from 2018 show unauthorized immigrants paid $300 million in taxes, with $108.8 million going to state and local governments, while $191.2 million went to the federal government.
Despite contributing to public coffers, unauthorized immigrants cannot access most social welfare programs. This imbalance means taxes paid by unauthorized immigrants account for a larger percentage than the share of government benefits they receive.
Critical entitlement programs such as Social Security and Medicare both receive funding from immigrant tax contributions. Recent research found that both native- and foreign-born workers’ tax contributions were unable to cover their publicly-provided benefits in the short-run. The study concluded that “immigrants’ tax contributions cover 93% of their publicly-provided benefits, while natives’ contributions cover only 77% of theirs.” The study also found immigrants to be more costly in terms of public support at the state and local levels due to higher education costs. Refugees, on the other hand, represent a net fiscal benefit nationally when comparing public benefit expenditures and tax revenue; revenue exceeded expenditures by $63 billion.
Link to the world economy
Connections to global networks allow immigrants to bring foreign investment to Minnesota and maintain a high level of exports. Research from the Small Business Administration (SBA) shows that “immigrant-owned businesses are more likely to export than are non-immigrant owned businesses.” Nationally, immigrant businesses maintain a high share of exports and 7.1% of immigrant firms export compared to 4.4% of nonimmigrant firms. One explanation for this difference is that immigrants maintain connections to business networks in their home countries. Their similar cultural ties and shared languages make business transactions easier. Countries involved in trade relationships that share the same languages have 42% more trade between them than countries where the languages are different. Immigrants also bring cultural diversity to Minnesota, adding to the assets of the state. Marketing these assets can both attract firms and additional investment.
With support from The McKnight Foundation
![]()
Navigate the report


SHARE
Recommended Articles